
The US Fed just made the biggest interest-rate increase since 1994. Should we be worried? Stephen Dover, Head of Franklin Templeton Institute, discusses the rising risk of a recession.
After months of fretting about soaring inflation, markets are now fully in recession-fear mode. Yield curves are flattening, credit spreads are widening, and equities are slumping—traditional recession alerts. Meanwhile, captains of industry and finance are warning of impending “hurricanes,” “super bad feelings”—and possibly even worse.
The proximate cause of the latest market selloffs was the May US Consumer Price Index report, which came in hotter than expected in both headline and core terms.1 It also presented an unnerving picture of broadening price pressures across the economy. Investors responded by ratcheting up expectations for Federal Reserve (Fed) rate hikes, and the Fed responded by increasing rates 0.75% Wednesday, with another potential 0.75% in July and more increases beyond that.
Investors were already rattled by the recent monetary policy U-turn from the European Central Bank (ECB), which abruptly shifted from a cautious to an unambiguously hawkish stance. The ECB is now expected to raise interest rates a quarter-point in July, with additional and potentially larger moves in the autumn. The ECB will now join some 80% of major central banks in raising rates in 2022.2
Soft landings are uncommon
History is unkind to the notion of “soft landings.” When central banks jack up interest rates, rising unemployment and recessions typically follow. According to a New York Federal Reserve study, in 11 out of 15 tightening cycles since 1955, the US unemployment rate has risen, in most of those cases leading to recession.3 Tightening cycles are also frequently accompanied by financial stress, failure, or crisis. When inflation is this high and this many central banks are tightening simultaneously, the odds of slowing inflation without high economic or financial cost are even lower.
In this piece, we look at various financial and economic indicators to offer our own assessment of recession risk. We also provide insights into the likelihood of an earnings recession (i.e., an outright decline in reported corporate profits).
Our take? The rapidly shifting consensus is largely correct. While still not the certain outcome, the risk of recession is rising. And the odds of a corporate profit slump are even higher. Fasten seatbelts and hang on, there is turbulence ahead, and the landing looks dicey.
Looking for major turning points
Over time and across countries, business cycles have been studied extensively. Given their frequency, a relatively large number of recessions provides sufficient observations to use statistical analysis to discern how financial and economic indicators perform immediately before, during and after slumps. That allows statisticians to derive probabilities of future recessions over the next one or two years.
The Franklin Templeton Institute developed several models to gauge business and profit-cycle risks. The aim is not to forecast growth, inflation or corporate earnings, much less the usual ups and downs of financial markets. Rather, our tools allow us to gauge when major cyclical turning points may be arriving, so that we can better advise our firm and its clients as they make their investment decisions.
Our work is based on careful analysis of how various financial and economic variables behave over the business cycle. Sifting through the candidates, there are about 10 indicators that have traditionally captured turning points in the economy: yield curves, credit spreads, consumer sentiment, business sentiment, broad measures of financial conditions, the labor market, purchasing manager indices, oil prices, housing activity and—for the United States—state-level measures of economic conditions.
Using basic statistical techniques, these measures can be used individually or in tandem to calculate at any given point in time the probability of a recession over the next 12 months.
Models, of course, are not infallible. Changes in the economy can alter the lead and lag times between indicators and outcomes. They can even make certain indicators less predictive. For instance, well-known disruptions to global goods consumption, production, and distribution patterns due to the COVID-19 pandemic may diminish the reliability of manufacturing surveys, such as purchasing manager indexes, for recession probability calculation. In all cases, quantitative models must be augmented by qualitative analysis.
Recession odds increase
What, then, do our indicators say about recession odds? Worryingly, our broad probability model suggests the odds of a US recession in the next 12 months have roughly doubled, from about 20% late last year to nearly 40% today.4 That’s roughly the same as a Bloomberg published model that uses a single input, the shape of the US Treasury yield curve. Even more distressing, Bloomberg’s two-year, multivariate recession probability model suggests the odds of a US recession over the next 24 months are now over 70%!5
The cycle in pictures
For some readers, it may be useful to highlight how key recession metrics look today and how they relate to past business cycles. In the following series of charts, we look at six key metrics that signal a recession: US Treasury yield curve, oil prices, consumer expectations, chief executive officer (CEO) sentiment, unemployment and rate hikes.
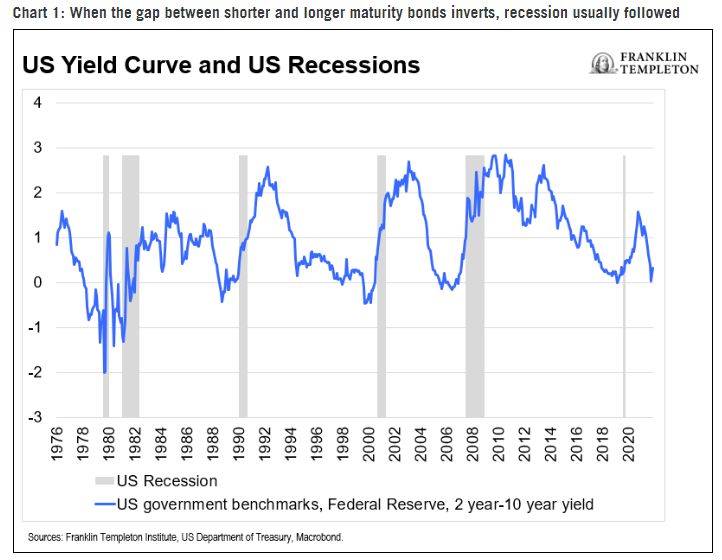
In Chart 1, we present the US Treasury yield curve spreads alongside prior US recessions, as indicated by the shaded regions of the chart. When the gap between shorter and longer maturity bonds flips (inverts) from positive to negative, the economy often dips into recession. Presently, the US yield curve has only flattened but has not decisively inverted, so this is a key indicator to watch in the weeks ahead.
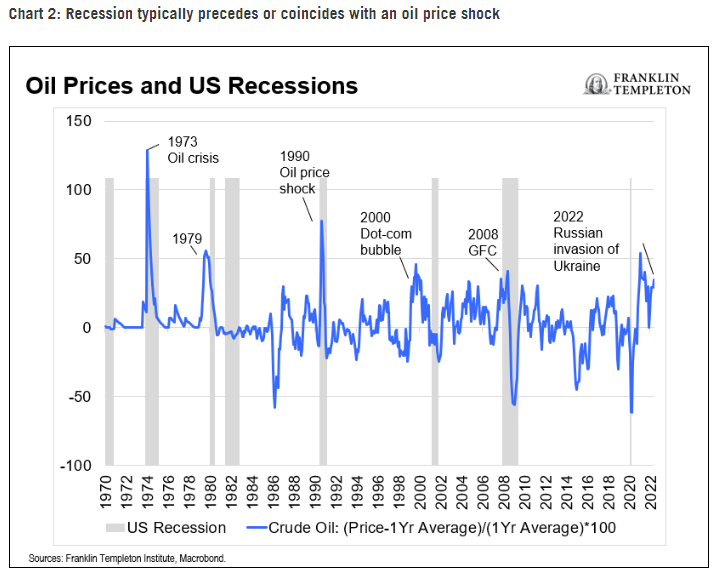
Oil price spikes have also preceded seven of the past nine US recessions, as shown in Chart 2. Given the doubling of global crude oil prices over the past year, that ought to be a worrisome development for the year ahead.
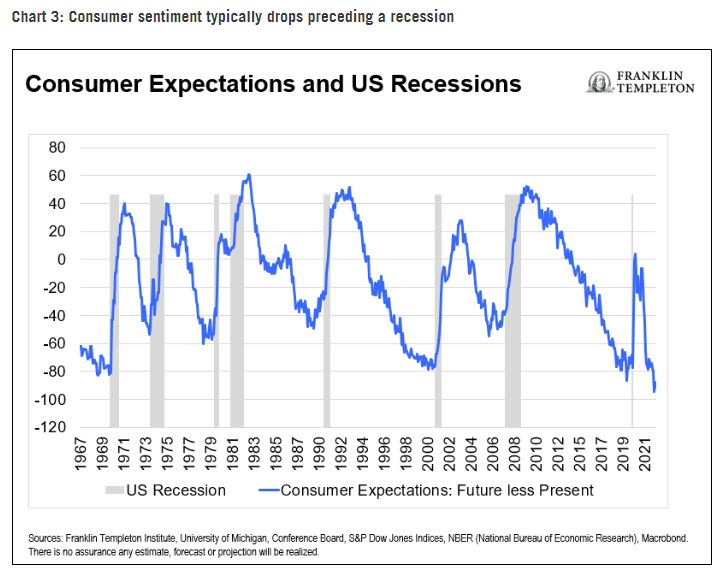
Given surging inflation, and in particular big jumps in the prices of everyday necessities, it is unsurprising that consumer sentiment has recently slumped. But according to the widely followed University of Michigan survey of households, consumer sentiment has now plunged to its lowest records since the university began gathering such data in 1952.6 That is astounding: US consumers are more dismal today than at the worst points of the global financial crisis! And then again, perhaps that is not surprising, given that virtually all households are hurt by price increases that outstrip wage gains.
But more alarming is the relationship between consumer sentiment about current conditions and what they believe the future will hold (Chart 3). Similar patterns in the past have typically preceded recessions. Notably, consumer sentiment around big ticket purchases—cars, homes and household appliances—is now at record lows.
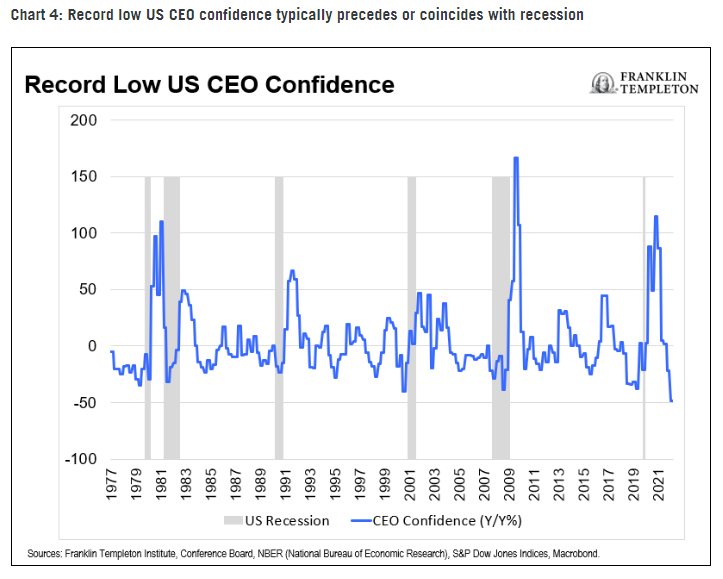
As noted above, leaders of industry and finance have also voiced concerns about the economic outlook. Those anecdotes are backed up by the data. The Conference Board survey of CEOs has plunged to its all-time lows, as shown in Chart 4.
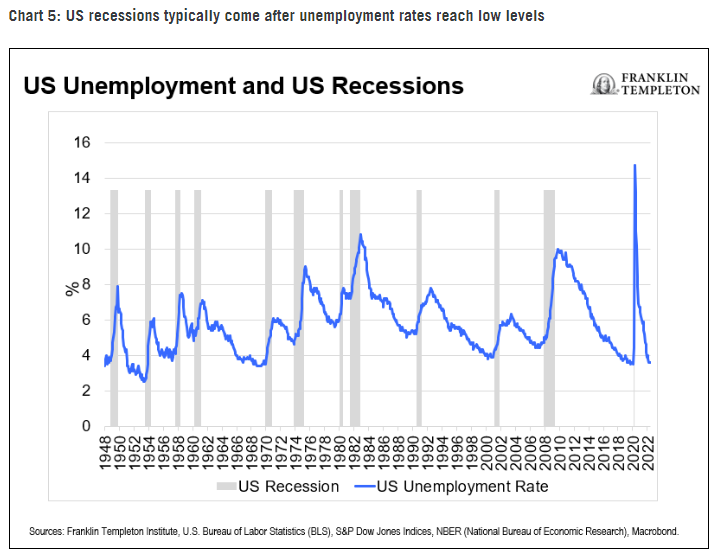
With unemployment at a near 50-year low, a strong labor market will sustain household incomes and hence spending, right?
Not necessarily. Low levels of unemployment are the norm prior to recessions, as Chart 5 indicates. According to research published by the Federal Reserve Bank of St. Louis, recessions typically start when the three-month moving average of the unemployment rate rises by a mere half percentage point from its cyclical low.7 Of course, given labor scarcities, particularly for skilled workers, firms today may be more reluctant than usual to lay off employees. Labor hoarding could, in theory, keep the economy out of recession for longer than usual. Of course, that would come at the expense of corporate profits, which is a double-edged outcome for equity and credit investors.
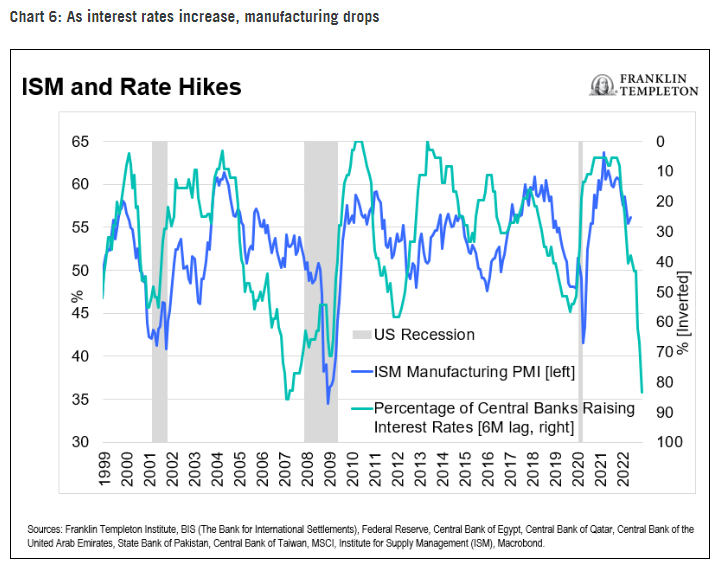
Another pushback on recession risk is that the consumer is still strong as shown in the elevated level of many purchasing manager indices, including the US Institute for Supply Measurement (ISM) index. Those relatively high readings, however, reflect a one-time surge in household demand for goods during the pandemic, reinforced by fiscal expansion, and enduring shortages of goods supply that continues to keep manufacturers busy. But manufacturing is typically vulnerable to higher interest rates. And as Chart 6 shows, the future for manufacturers will be challenged by the large numbers of central banks now hiking rates.
Finally, it is worth noting that rising risks of economic recession imply very high risks of a corporate profit recession. Aggregate profits growth is highly cyclical, rising and falling with the ups and downs of the economy. That’s because profit margins are sensitive to economic growth. Incorporating these and other factors into an earnings recession probability model, our work suggests that the odds of an outright decline in US corporate profits over the next 12 month are now 20% (up from 2% a year ago).8
In sum, markets are shaky, and investors are justifiably worried about the future. So, too, are business leaders and ordinary households. Our work confirms they have reason to worry. Current economic, policy, and financial conditions all point to a significant global economic slowdown, quite possibly a recession. And the outlook for corporate profits is dimming. It will take time and, perhaps, large dollops of good fortune to avoid economic and profits recessions in the year ahead.
Endnotes
1. The “core” PCE price index is defined as personal consumption expenditures (PCE) prices excluding food and energy prices. The core PCE price index measures the prices paid by consumers for goods and services without the volatility caused by movements in food and energy prices to reveal underlying inflation trends.
2. Source: Franklin Templeton Institute.
3. “Monetary Tightening Cycles and the Predictability of Economic Activity.” Federal Reserve Bank of New York. October 2009.
4. Source: Franklin Templeton Institute.
5. Source: Bloomberg. 6/15/2022.
6. Sources: Macrobond, United States, Consumer Surveys, University of Michigan, Consumer Sentiment, Consumer Sentiment Index. First observation is listed in November 1952.
7. Source: Federal Reserve Bank of St. Louis Sahm Rule. The Sahm Rule identifies signals related to the start of a recession when the three-month moving average of the national unemployment rate (U3) rises by 0.50 percentage points or more relative to its low during the previous 12 months.
8. Franklin Templeton Institute. 6/15/2022.
Franklin Templeton Disclaimer:
Important legal Notice
This material is intended to be of general interest only and should not be construed as individual investment advice or a recommendation or solicitation to buy, sell or hold any security or to adopt any investment strategy. It does not constitute legal or tax advice. This material may not be reproduced, distributed or published without prior written permission from Franklin Templeton.
The views expressed are those of the investment manager and the comments, opinions and analyses are rendered as at publication date and may change without notice. The underlying assumptions and these views are subject to change based on market and other conditions and may differ from other portfolio managers or of the firm as a whole. The information provided in this material is not intended as a complete analysis of every material fact regarding any country, region or market. There is no assurance that any prediction, projection or forecast on the economy, stock market, bond market or the economic trends of the markets will be realized. The value of investments and the income from them can go down as well as up and you may not get back the full amount that you invested. Past performance is not necessarily indicative nor a guarantee of future performance. All investments involve risks, including possible loss of principal.
Any research and analysis contained in this material has been procured by Franklin Templeton for its own purposes and may be acted upon in that connection and, as such, is provided to you incidentally. Data from third party sources may have been used in the preparation of this material and Franklin Templeton (“FT”) has not independently verified, validated or audited such data. Although information has been obtained from sources that Franklin Templeton believes to be reliable, no guarantee can be given as to its accuracy and such information may be incomplete or condensed and may be subject to change at any time without notice. The mention of any individual securities should neither constitute nor be construed as a recommendation to purchase, hold or sell any securities, and the information provided regarding such individual securities (if any) is not a sufficient basis upon which to make an investment decision. FT accepts no liability whatsoever for any loss arising from use of this information and reliance upon the comments, opinions and analyses in the material is at the sole discretion of the user.
Products, services and information may not be available in all jurisdictions and are offered outside the U.S. by other FT affiliates and/or their distributors as local laws and regulation permits. Please consult your own financial professional or Franklin Templeton institutional contact for further information on availability of products and services in your jurisdiction.
Issued in the U.S. by Franklin Distributors, LLC, One Franklin Parkway, San Mateo, California 94403-1906, (800) DIAL BEN/342-5236, franklintempleton.com – Franklin Distributors, LLC, member FINRA/SIPC, is the principal distributor of Franklin Templeton U.S. registered products, which are not FDIC insured; may lose value; and are not bank guaranteed and are available only in jurisdictions where an offer or solicitation of such products is permitted under applicable laws and regulation.
CFA® and Chartered Financial Analyst® are trademarks owned by CFA Institute.
What are the risks?
All investments involve risks, including possible loss of principal. The value of investments can go down as well as up, and investors may not get back the full amount invested. Bond prices generally move in the opposite direction of interest rates. Thus, as prices of bonds in an investment portfolio adjust to a rise in interest rates, the value of the portfolio may decline.
MeDirect Disclaimers:
This information has been accurately reproduced, as received from Franklin Templeton Investment Management Limited (FTIML). No information has been omitted which would render the reproduced information inaccurate or misleading. This information is being distributed by MeDirect Bank (Malta) plc to its customers. The information contained in this document is for general information purposes only and is not intended to provide legal or other professional advice nor does it commit MeDirect Bank (Malta) plc to any obligation whatsoever. The information available in this document is not intended to be a suggestion, recommendation or solicitation to buy, hold or sell, any securities and is not guaranteed as to accuracy or completeness.
The financial instruments discussed in the document may not be suitable for all investors and investors must make their own informed decisions and seek their own advice regarding the appropriateness of investing in financial instruments or implementing strategies discussed herein.
If you invest in this product you may lose some or all of the money you invest. The value of your investment may go down as well as up. A commission or sales fee may be charged at the time of the initial purchase for an investment. Any income you get from this investment may go down as well as up. This product may be affected by changes in currency exchange rate movements thereby affecting your investment return therefrom. The performance figures quoted refer to the past and past performance is not a guarantee of future performance or a reliable guide to future performance. Any decision to invest in a mutual fund should always be based upon the details contained in the Prospectus and Key Investor Information Document (KIID), which may be obtained from MeDirect Bank (Malta) plc.